From Black Box to Glass Box: Monitoring Your NestJS API with OpenTelemetry - Andy Primawan
Tired of your API being a black box? Let's implement robust monitoring for a NestJS app using OpenTelemetry and Prometheus. We'll track RPM, failure rates, and top endpoints to gain crucial insights into your API's health and traffic patterns.
As full-stack engineers, we know the feeling. We push our backend API to production, it passes the health checks, and everything seems fine. But when users report slowness or an endpoint starts failing silently, our beautiful API suddenly feels like an opaque black box. Where do you even begin to look?
This is where observability comes in. Instead of guessing, we can collect data that tells us a story about our application's health. Today, we're going to focus on one of the key pillars of observability: metrics.
Our goal is to instrument a NestJS REST API to understand its performance and usage patterns. We'll track key metrics like:
- Requests Per Minute (RPM) to see traffic flow.
- HTTP 4xx and 5xx error rates to catch issues proactively.
- A list of the most frequently called endpoints to identify hotspots.
We'll use the powerful combination of OpenTelemetry (via the excellent nestjs-otel library), Prometheus for data storage, and Grafana for beautiful, insightful dashboards. By the end of this post, you'll have a clear, actionable path to adding this essential monitoring to your own projects.
The Setup: Project Structure
We'll be working with a standard NestJS project structure. The key files we'll create or modify are:
src/
├── app.controller.ts
├── app.module.ts
├── app.service.ts
├── main.ts
└── tracing.ts        <-- We will create this
Step 1: Install the Dependencies
First things first, let's get the necessary packages. We'll need nestjs-otel which bundles many of the core OpenTelemetry packages for us, and the Prometheus exporter to expose our metrics.
npm install --save nestjs-otel @opentelemetry/exporter-prometheus @opentelemetry/api
@opentelemetry/api provides the core interfaces and functions for instrumentation, which nestjs-otel builds upon.
Step 2: Configure the Tracer
OpenTelemetry needs to be initialized before your application code runs to ensure all modules are properly instrumented.
Let's create a new file at src/tracing.ts. This file will handle the basic OpenTelemetry SDK configuration.
src/tracing.ts
import {
  CompositePropagator,
  W3CTraceContextPropagator,
  W3CBaggagePropagator,
} from '@opentelemetry/core';
import { BatchSpanProcessor } from '@opentelemetry/sdk-trace-base';
import { JaegerExporter } from '@opentelemetry/exporter-jaeger';
import { getNodeAutoInstrumentations } from '@opentelemetry/auto-instrumentations-node';
import { JaegerPropagator } from '@opentelemetry/propagator-jaeger';
import { B3Propagator } from '@opentelemetry/propagator-b3';
import { PrometheusExporter } from '@opentelemetry/exporter-prometheus';
import { NodeSDK } from '@opentelemetry/sdk-node';
import { AsyncLocalStorageContextManager } from '@opentelemetry/context-async-hooks';

const otelSDK = new NodeSDK({
  metricReader: new PrometheusExporter({
    port: 8081,
  }),
  spanProcessor: new BatchSpanProcessor(new JaegerExporter()),
  contextManager: new AsyncLocalStorageContextManager(),
  textMapPropagator: new CompositePropagator({
    propagators: [
      new JaegerPropagator(),
      new W3CTraceContextPropagator(),
      new W3CBaggagePropagator(),
      new B3Propagator(),
    ],
  }),
  instrumentations: [getNodeAutoInstrumentations()],
});

export default otelSDK;

// You can also use the shutdown method to gracefully shut down the SDK before process shutdown
// or on some operating system signal.
process.on('SIGTERM', () => {
  otelSDK
    .shutdown()
    .then(
      () => console.log('OpenTelemetry SDK shut down successfully'),
      (err) => console.log('Error shutting down OpenTelemetry SDK', err),
    )
    .finally(() => process.exit(0));
});
This setup initializes the SDK and configures it to use the PrometheusExporter, which automatically creates a /metrics endpoint that Prometheus can scrape.
Step 3: Start Tracing in main.ts
Now, let's hook our new tracer into our application's lifecycle. The key is to start it before NestFactory.create(). This allows OpenTelemetry's auto-instrumentation to patch libraries like http and express before NestJS even starts using them.
src/main.ts
import { NestFactory } from '@nestjs/core';
import { ConfigService } from '@nestjs/config';
import otelSDK from './tracing';
import { AppModule } from './app.module';

async function bootstrap() {
  // Start SDK before nestjs factory create
  otelSDK.start();

  const app = await NestFactory.create(AppModule);

  // Using ConfigService to get configuration
  const configService = app.get(ConfigService);
  const port = configService.get<number>('PORT', 3000);

  await app.listen(port);
  console.log(
    `Dojotek AI Chatbot backend is running on: http://localhost:${port}`,
  );
}

bootstrap().catch((error) => {
  console.error('Error starting Dojotek AI Chatbot backend:', error);
  process.exit(1);
});
With this, our application is now fully instrumented! All incoming HTTP requests and many other operations will automatically generate trace and metric data.
Step 4: Add the OpenTelemetry Module to app.module.ts
While auto-instrumentation covers a lot, nestjs-otel provides deeper integration with the NestJS framework itself (like associating traces with controllers and services). Let's add its module to our AppModule.
src/app.module.ts
import { Module } from '@nestjs/common';
import { AppController } from './app.controller';
import { AppService } from './app.service';
import { OpenTelemetryModule } from 'nestjs-otel';

@Module({
  imports: [
    OpenTelemetryModule.forRoot({
      metrics: {
        hostMetrics: true, // Includes Host Metrics
        apiMetrics: {
          // @deprecated - will be removed in 8.0 - you should start using the semcov from opentelemetry metrics instead
          enable: false, // Includes api metrics
          defaultAttributes: {
            // You can set default labels for api metrics
            // custom: 'label',
          },
          ignoreRoutes: ['/favicon.ico'], // You can ignore specific routes (See https://docs.nestjs.com/middleware#excluding-routes for options)
          ignoreUndefinedRoutes: false, // Records metrics for all URLs, even undefined ones
          prefix: 'my_prefix', // Add a custom prefix to all API metrics
        },
      },
    }),
  ],
  controllers: [AppController],
  providers: [AppService],
})
export class AppModule {}
This configuration enriches our metrics with useful Node.js and host-level information, giving us a more complete picture of our application's performance.
What's Next? Visualizing in Grafana
With the code in place, your /metrics endpoint is now serving a stream of OpenTelemetry data in a format Prometheus understands. The next steps are:
- Run Prometheus: Configure your
prometheus.ymlfile to scrape thehttp://localhost:8081/metricsendpoint of your running NestJS application. - Run Grafana: Add Prometheus as a data source in Grafana.
- Build Dashboards: Create panels using PromQL (Prometheus Query Language) to visualize the data.
Here are a few example queries to get you started:
NestJS HTTP Request per Minute PromQL
sum(rate(http_server_duration_count{http_route!=""}[$__rate_interval]))*60 or vector(0)NestJS HTTP Top Called Routes PromQL
topk(10, sum by (http_method, http_route)(
  increase(http_server_duration_count{http_route!=""}[$__range])
))
NestJS HTTP 5xx Server Error Rate PromQL
(
  100 *
  sum(rate(http_server_duration_count{http_route!="", http_status_code=~"5.."}[$__rate_interval]))
  /
  clamp_min(
    sum(rate(http_server_duration_count{http_route!=""}[$__rate_interval])),
    1
  )
) or on() vector(0)
NestJS HTTP 4xx Client Error Rate PromQL
(
  100 *
  sum(rate(http_server_duration_count{http_route!="",http_status_code=~"4.."}[$__rate_interval]))
  /
  clamp_min(
    sum(rate(http_server_duration_count{http_route!=""}[$__rate_interval])),
    1
  )
) or on() vector(0)
NestJS HTTP Top Routes with 5xx Server Error PromQL
topk(10, sum by (http_method, http_route)(
  increase(http_server_duration_count{http_route!="",http_status_code=~"5.."}[$__range])
))
NestJS HTTP Top Routes with 4xx Client Error PromQL
topk(10, sum by (http_method, http_route)(
increase(http_server_duration_count{http_route!="",http_status_code=~"4.."}[$__range])
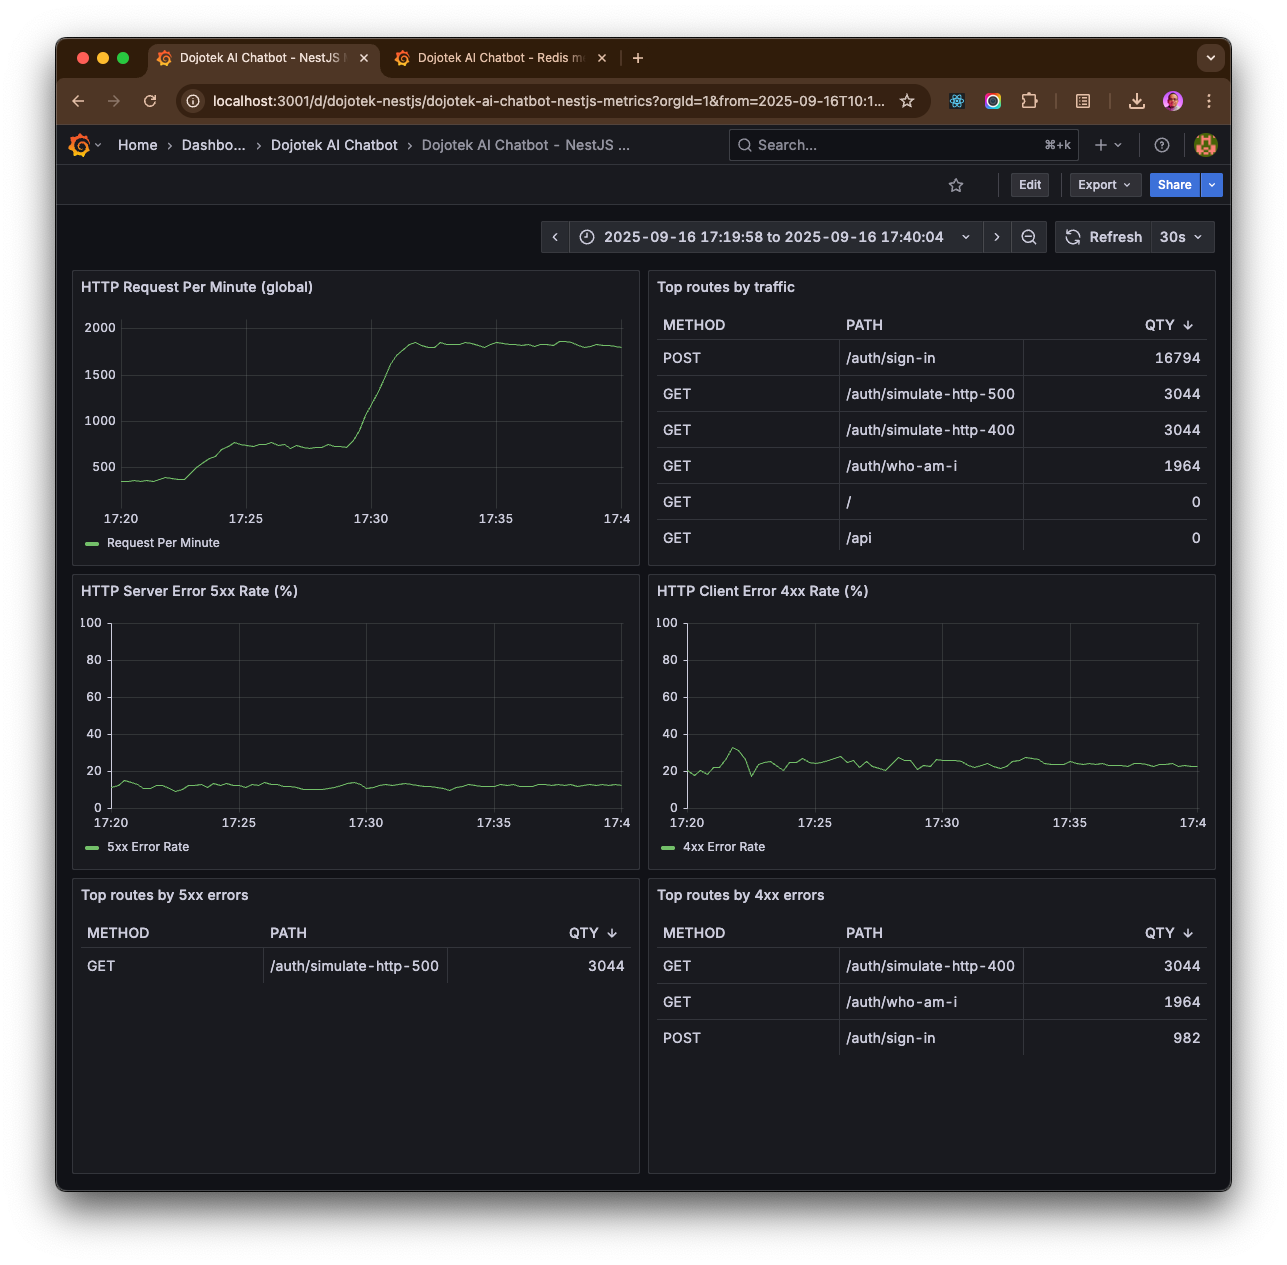
))Here the Grafana Dashbord for NestJS REST API on my laptop:
See the Full Code
We've covered the core implementation, but seeing it all together in a working repository is even better. You can check out the final source code for these files in my GitHub repository:
- Dojotek AI Chatbot backend repository: backend
- to run Prometheus and Grafana: docker-compose.yml
- config file to tell Prometheus to scrape metrics: prometheus.yml
- to setup the Open Telemetry for Node.js: tracing.ts
- import the tracing file and start on start-up: main.ts
- to start and configure the NestJS-otel module: app.module.ts
Implementing observability isn't a one-and-done task, but by taking these first steps, you transform your NestJS API from a black box into a transparent, monitorable system. Happy coding
You also can import the Grafana Dashboard to visualize your NestJS REST API using JSON, from the following public GitHub gist: